
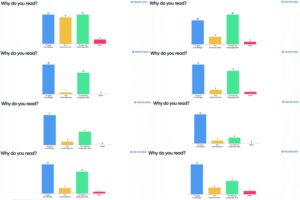
Adults love data. They love graphs and statistics and numbers. During workshops with adults, the moment I put up a graph, I have everyone's attention as if I'm finally saying something 'real'.And that's why I started working with real-time polls through Mentimeter. I show my audience a question and all those with smart phones (usually nearly everyone in the room) vote. And they see numbers, which makes everyone happy.Question One: What do you read most often?For this question, I allow participants to choose more than one option. This helps them feel comfortable, not pinned down to choosing one and being 'wrong'.I give them four options:Blue - Newspapers, magazines, etc.Yellow - Facebook/WhatsApp postsGreen - StorybooksRed - OtherAs you can see, there's nothing really, solidly conclusive about this. Yet, on the whole, have a look at this graph, which combines the … [Read more...]